ABC Analysis and Inventory Management

You may have talked your whole career about analyzing your inventory using ABC analysis or you’ll review using a Pareto analysis attempting to reduce inventory and you may not know how to go about it or you really don’t know what those terms really mean. I’m not going to do this article on Pareto analysis, but suffice it to say that the “Pareto Principle” says you use 20% of what you have 80% of the time or some fraction like that. What we’re going to discuss here is planning and ordering material using an ABC analysis and ordering the material primarily using a minimum/maximum stocking method.
Most organizations have a computer system that tracks material usage. The first action done in this analysis is run a report to identify items used within the materials system by annual quantities consumed by both dollars and quantity. The annual consumption value is calculated by the formula: (Annual demand) x (cost per unit).
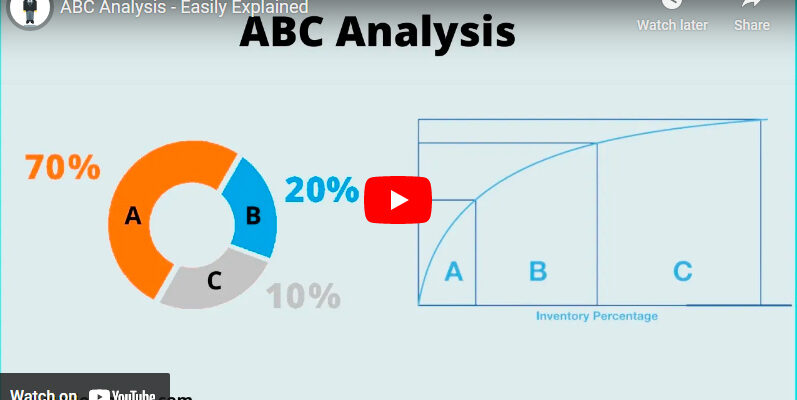
- A-items are goods where the annual consumption value is the highest. The top 70-80% of the annual consumption value of the company typically accounts for only 10-20% of total inventory items. These items are in two categories, high cost low usage and moderate cost high volume. If you want to have the biggest effect on inventory this is where you should spend your time.
- C-items are, on the contrary, items with the lowest consumption value. The lower 5% of the annual consumption value typically accounts for 50% of total inventory items. These items are almost always low cost high volume.
- B-items are the interclass items with a medium consumption value. Those items with only 15-25% of annual consumption value that typically account for 30% of total inventory. These items are very closely associated with “C” items and, unless there are specific exceptions, can be treated as “C” items. If there is a need to differentiate, you can just add a week or two of lead-time.
- Special Class items are capital asset spares and back up “Just in case” spares (fire pumps, generators, other) and other items that do not fit the regular consumption pattern of normal ABC items.
| Items | Stock | Order Frequency | Lead time |
| “A” | Minimum | Monthly/Quarterly Scheduled Delivery (high cost low volume)
|
20 Days |
| “C” | Medium to Heavy | Min/Max | 5 Days |
| “B” | Minimum | Min/Max | 10 Days |
| Special Class | On hand | Min/Max (order one when you use one) | 1/1 (check with user whether to reorder) Long Lead Time |
The planning method for these various items is usually done using min/max levels.
- Use min-max planning to maintain inventory levels for all items or selected items.
- Specify minimum and maximum inventory levels for your items.
- Suggestion of a new requisition to bring the balance back up to the maximum when the inventory level for an item drops below the minimum (only order enough to get to the maximum).
There are numerous variables that might come into play when setting min/max levels that makes giving a general rule of thumb difficult. Some of these are listed below.
A. Variation in usage.
B. Cost of item (qty. breaks?).
C. Item shelf life.
D. Physical size and storage costs.
E. Time frame and ease of replenishment.
F. Cost associated with running out (ease of substitution).
If using an Excel spreadsheet, you might want to calculate an average and standard deviation of past usage to come up with a “baseline” rule of thumb. This should be something like a “2 week average + 1.5 standard deviations” which theoretically would cover approx. 90 – 95% of usage “if” the usage remains the same.
Notice the “if” in that usage often changes and therefore it is critical to have the “hand of man” perform ongoing reviews that would identify which items need to be adjusted from the formula.
If your goal is to achieve high levels of inventory turns and minimize stock outs, these on-going reviews and changes to individual min/max targets are a must. Just don’t set them and let them go for 6 months to a year. Take the time to identify the “drivers” of usage and causes of demand variation. Every time you run out of something you’re supposed to have it is a good trigger to check the target levels and ask “why” is the target set at the current level? Why did we run out? Why did the demand vary?
It certainly would help to be able to calculate upcoming demand so that you can have a pull system generating visibility as to when you are going to go below the minimum target.
Don’t put the numbers in a spreadsheet and leave it to continue planning forever. It’s a big mistake and it will get inventory totally out of whack! This also goes for a fancy ERP program that is part of the total system like SAP or Oracle. Continued review is necessary. Check the accuracy of inventory and whether or not what is happening makes sense. Don’t allow something dumb to occur just because the program said to do it that way!
Your path to business success.
Rick Wakeland
Rick Wakeland is a proven executive leader with over 30 years in senior management experience in industry and consulting. In Industry he has managed complex supply chain operations, at a senior level, and as a senior consultant and project leader directed and trained large groups of people in a collaborative team environment, solving critical business issues and implementing changes for areas requiring significant improvement. His work has included maintenance reliability and production improvements to achieve targeted profit improvement objectives using a structured approach and schedule to ensure the best solutions are implemented in the shortest possible time. He’s held a myriad of roles, for example: A general manager, a director of purchasing, and a director of material services and materials manager. He has also, consulted with firms in various businesses, that included: ExxonMobil – Worldwide, Potash Corporation, Bristol Myers Squibb, Novartis International, Cleaver Brooks Boiler manufacturers, EI DuPont, and others. You can reach him at: rwakeland@ureach.com. +1-207-468-8388